How to set and track Performance Goals
Performance Goals add a dotted target line to your graphs so you can tell at a glance whether a day or reporting period reached its target. You can create a different goal for each supported metric, including royalties, units sold, orders, KENP reads, and spending.
Goals are saved to your Publisher Champ account, so they remain available when you return on another device.
Watch the video guide
See the complete Performance Goals workflow, from setting a target to checking progress and removing a goal.
Set a goal
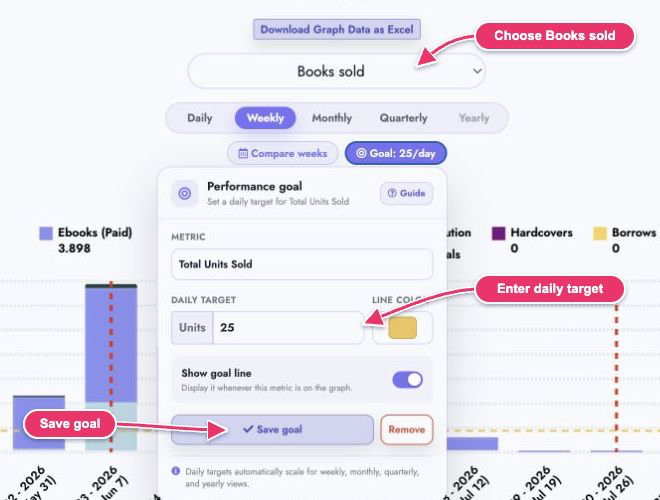
- Open a supported graph on Dashboard Visual, Dashboard Detailed, Book Stats, Historical Stats, or Ads Monitoring.
- Choose the graph you want to measure. For example, select Books Sold for a unit target or Spending for a spending target.
- Select Goals. The metric is matched to the selected graph, so you set a unit goal for a units graph, a reads goal for a KENP graph, and a currency goal for a royalties or spending graph.
- Enter the target. Units sold, orders, and reads use whole numbers; currency and percentage metrics allow the appropriate precision.
- Choose the dotted-line color and leave Show goal line enabled.
- Select Save goal. The editor closes and the goal appears on the graph.
Examples of useful daily goals include:
- Gross Royalties: £500 per day
- Total Units Sold: 25 units per day
- Total Orders: 20 orders per day
- KENP Reads: 1,500 reads per day
- Total Spend: £100 per day
See the goal on the graph
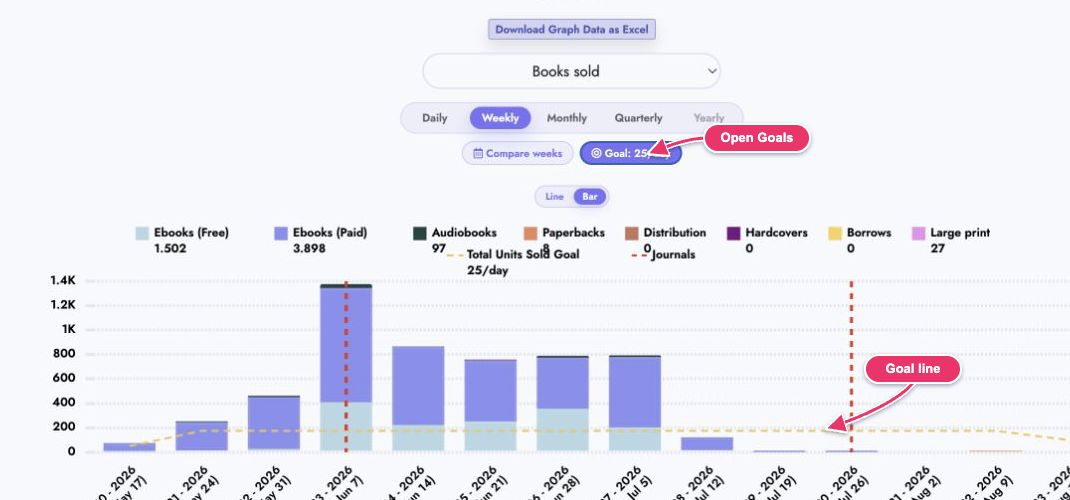
The goal appears as a dotted horizontal line in the color you selected. Its legend label shows both the metric and the saved daily target—for example, Total Units Sold Goal 25/day.
Only goals that are compatible with the selected graph are displayed. Changing to a different graph does not delete the goal; it reappears when you return to the matching metric.
Read Goal Progress in a tooltip
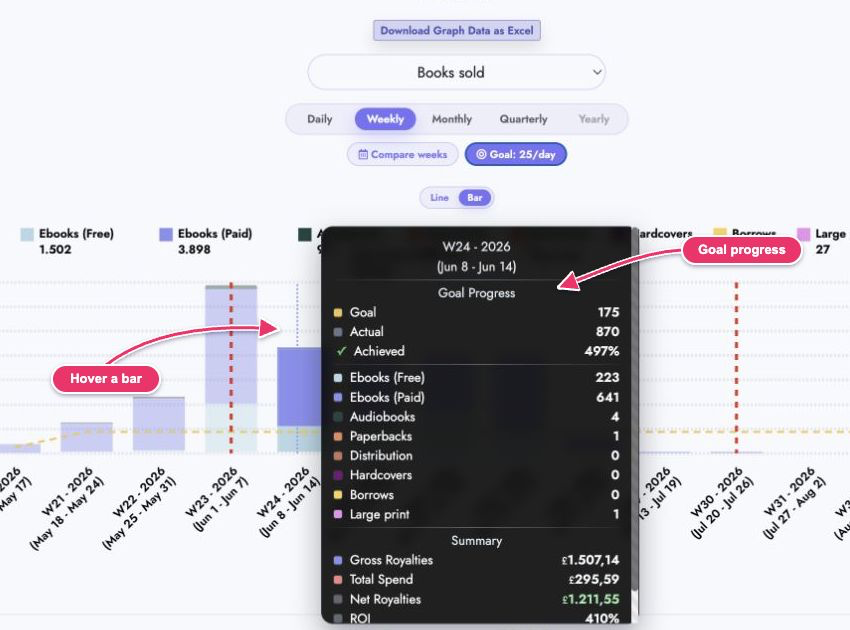
Hover a date or reporting period to open its tooltip. The separate Goal Progress section shows:
- Goal: the target for that date or period, using the dotted-line color
- Actual: the value recorded for the selected goal metric
- Achieved: the percentage of the target reached
A green check means the result reached at least 100% of the goal. A friendly coral cross means it is below 100%.
How goals scale across time periods
Most goals start as a daily target and automatically scale by the number of days represented on the graph. A £100 daily goal becomes £700 for a seven-day week; monthly, quarterly, and yearly targets use the number of days shown in each period. Fixed-rate metrics such as percentages are not multiplied by days.
On Dashboard Detailed, the current-month and previous-month graphs keep separate goals. Open Goals on the graph you want to configure so each period can have its own target.
Goals with shared-access accounts
Goals are saved for the exact account selection shown on the graph. A goal for Account A is separate from a goal for Account B. If you select Account A and Account B together, that combined selection can have its own goal based on the combined graph data. Switching back to an earlier selection restores the goals you saved for that selection. The account order does not matter: Account A + Account B uses the same goals as Account B + Account A.
Goals remain personal to the logged-in shared-access user. They do not replace or modify goals created by the account owner or another shared-access user. Removing a goal only clears it for the account selection currently displayed.
Change, hide, or remove a goal
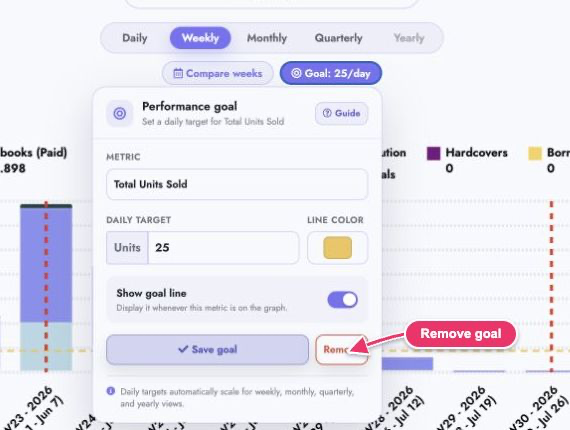
Open Goals again and select the goal's metric.
- To change it, edit the target or line color and select Save goal.
- To hide the line without deleting the target, switch off Show goal line and save.
- To clear it completely, select Remove. The editor closes, and the line and its goal-progress details disappear.
Quick troubleshooting
Why do I not see a saved goal after changing graphs?
The selected graph must contain the goal's metric. Return to the matching graph,
or open Goals to create a target for the new metric.
What is the difference between hiding and removing a goal?
Hiding keeps the saved target but stops drawing it. Removing deletes that
metric's goal from your account.
Why is the target larger in Weekly or Monthly view?
The graph scales daily targets to cover all days represented by that period.